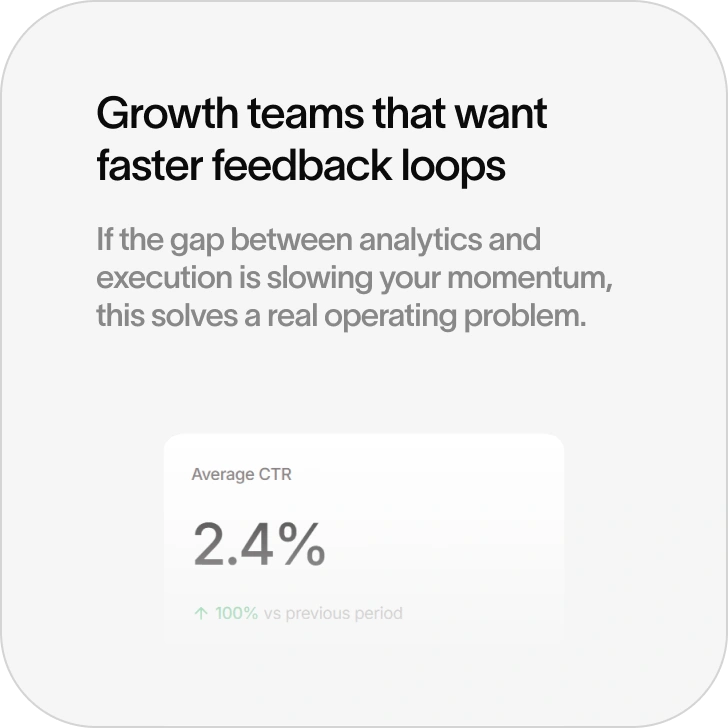
Analytics should feed action, not sit in another dashboard.
Site Analytics connects search performance data to the content workflow, so teams can see what is growing, what is slipping, and what deserves action next.
Most teams measure performance in one place and act somewhere else
That split slows everything down. Clicks, impressions, CTR, and rankings get reviewed in an analytics tool, then someone has to translate that into a spreadsheet, a content brief, a CMS ticket, or a meeting. By the time the team acts, the signal is old or the opportunity is gone.
Site Analytics closes that loop.
It puts performance data closer to the content workflow so teams can decide what to update, expand, refresh, or publish next without bouncing between disconnected systems.
What this page should show
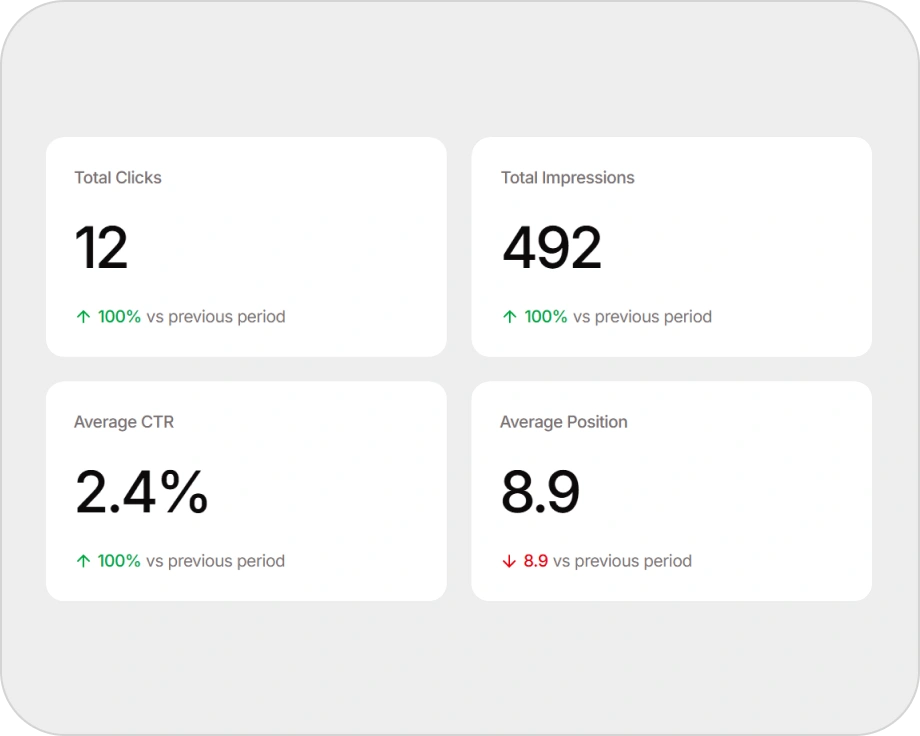
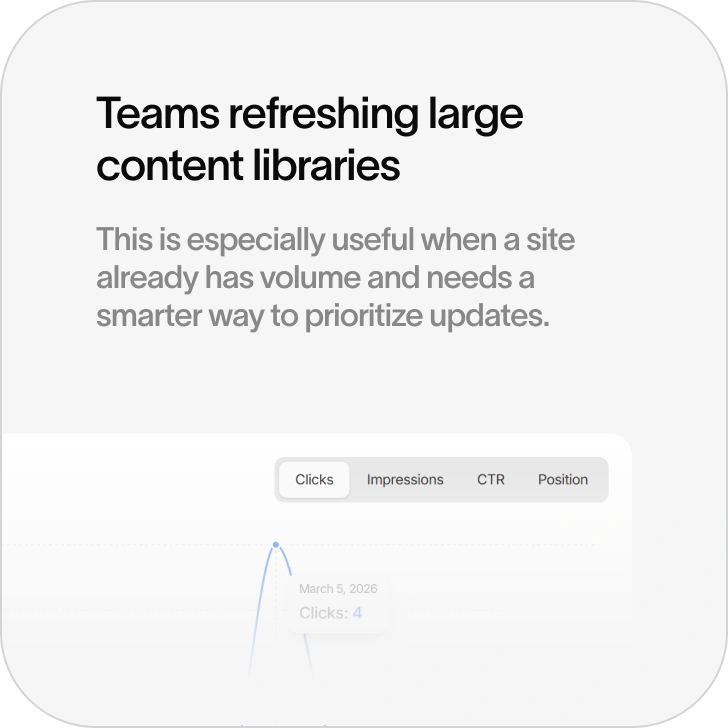
Google Search Console-connected performance
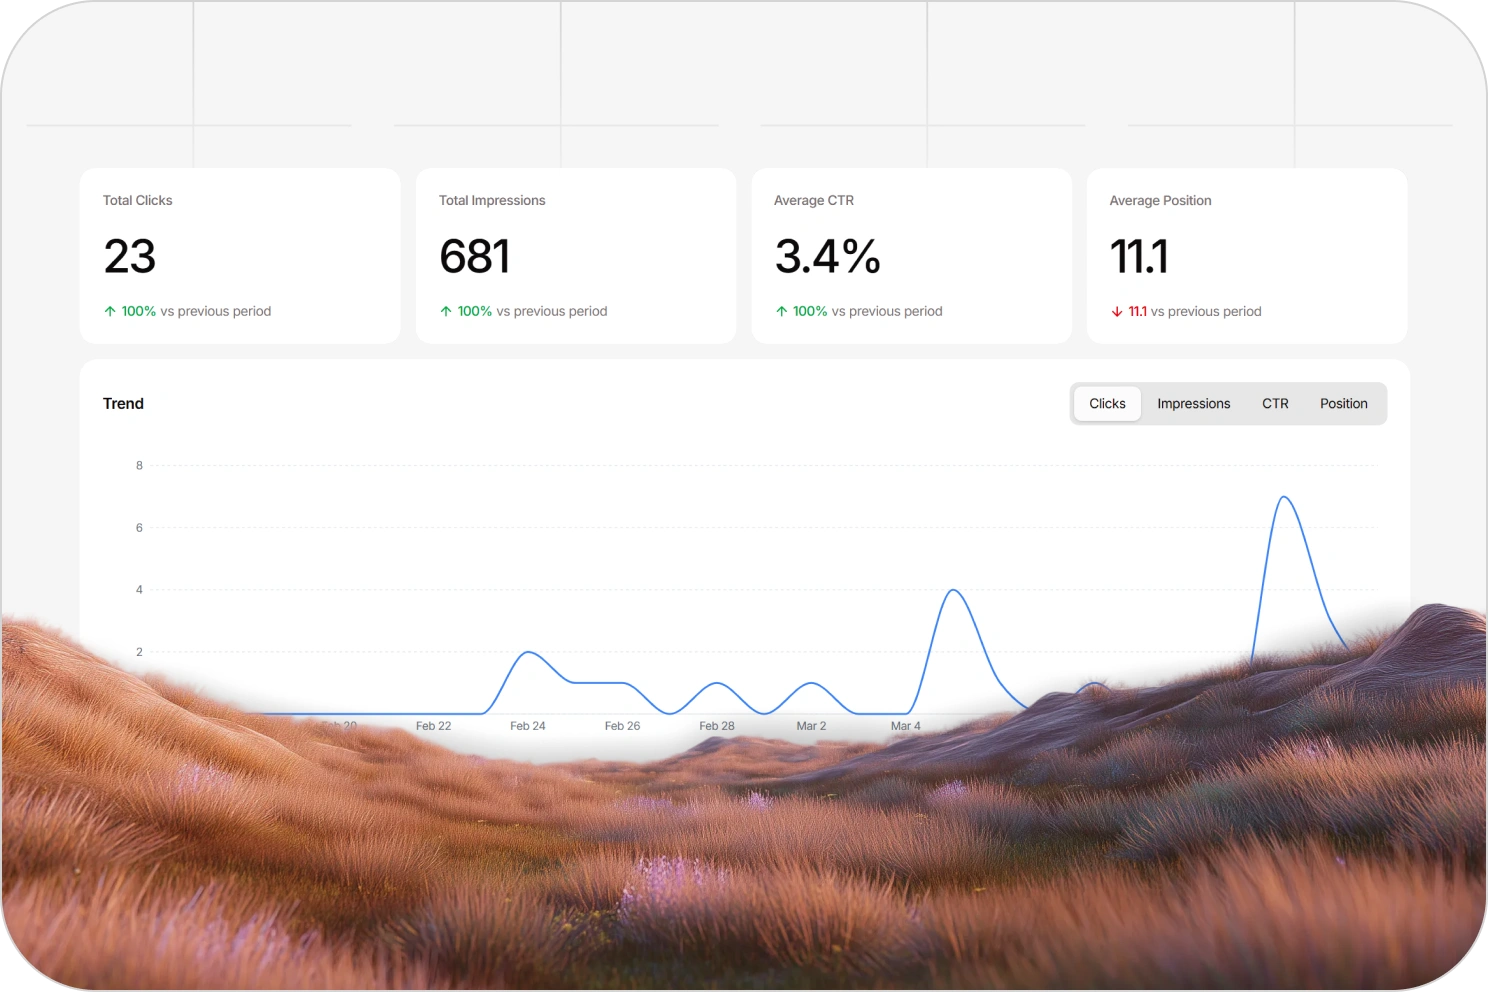
Track core signals like clicks, impressions, CTR, and average position over time inside the same workflow.
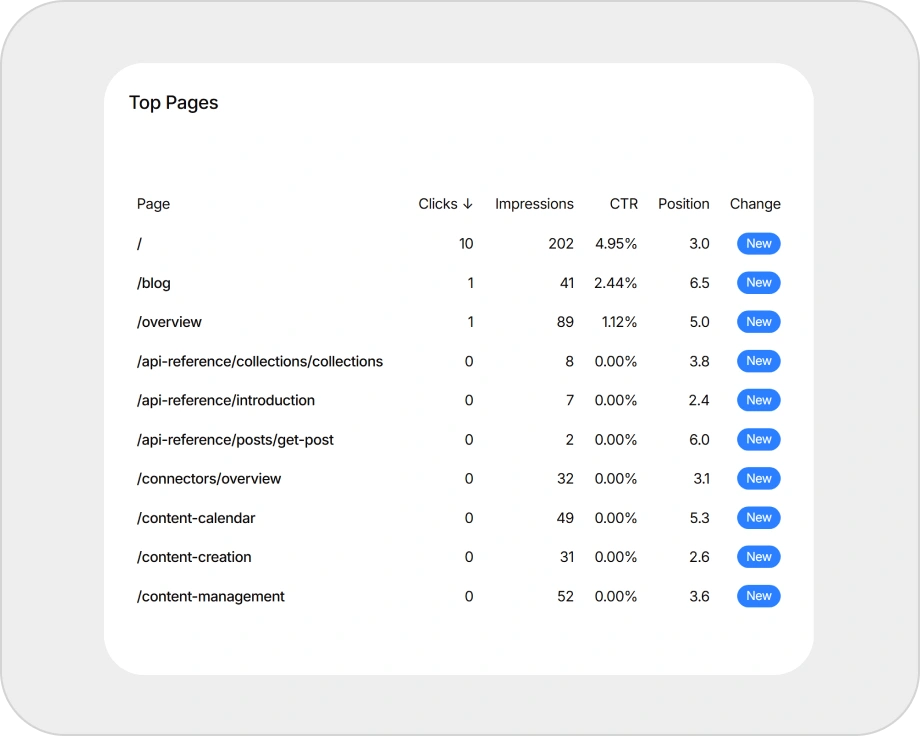
Page-level performance
See which pages are growing, flattening, or decaying before the losses compound.
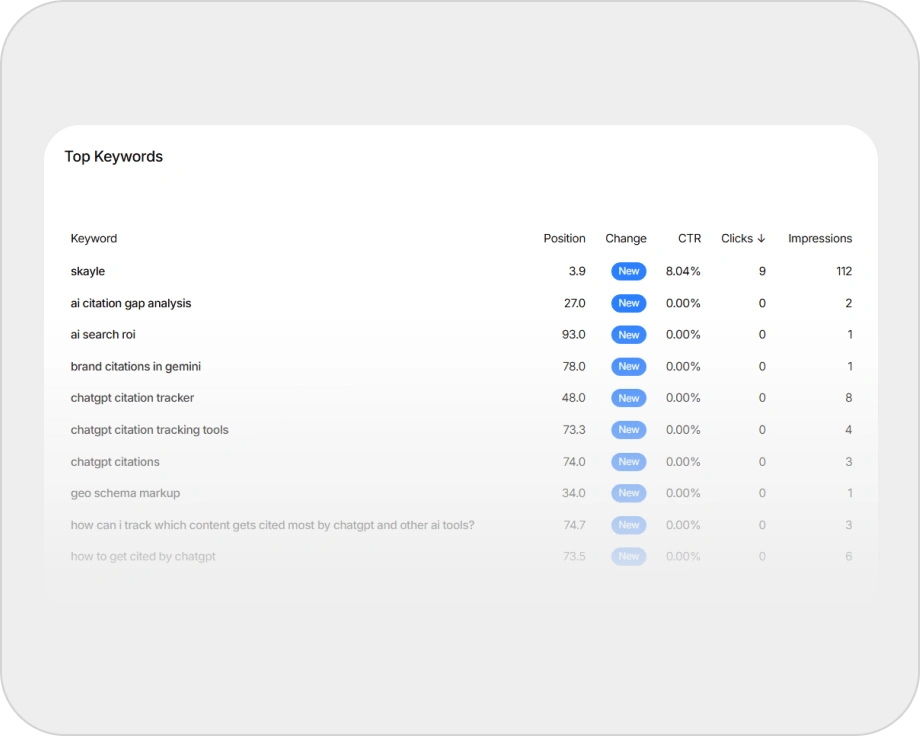
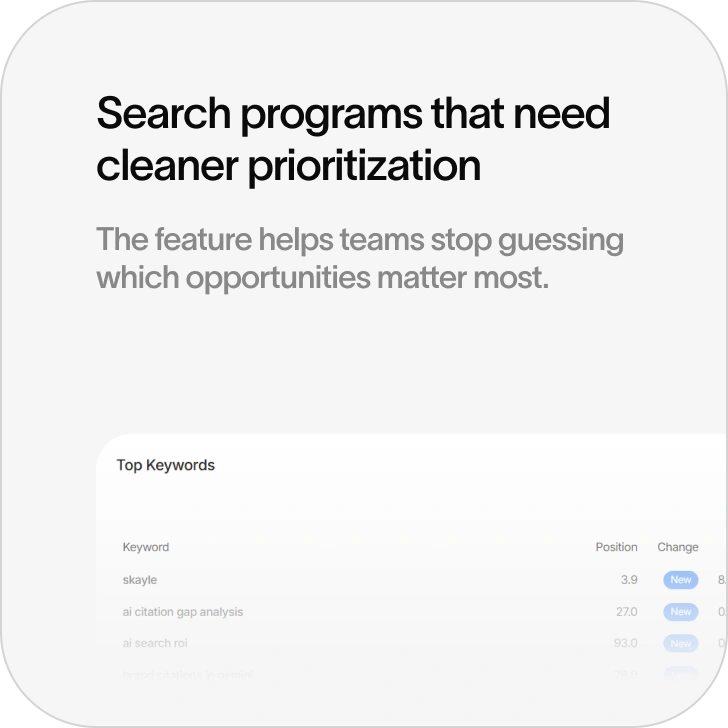
Query-level insight
Understand which queries deserve expansion, which pages need stronger coverage, and where demand is shifting.
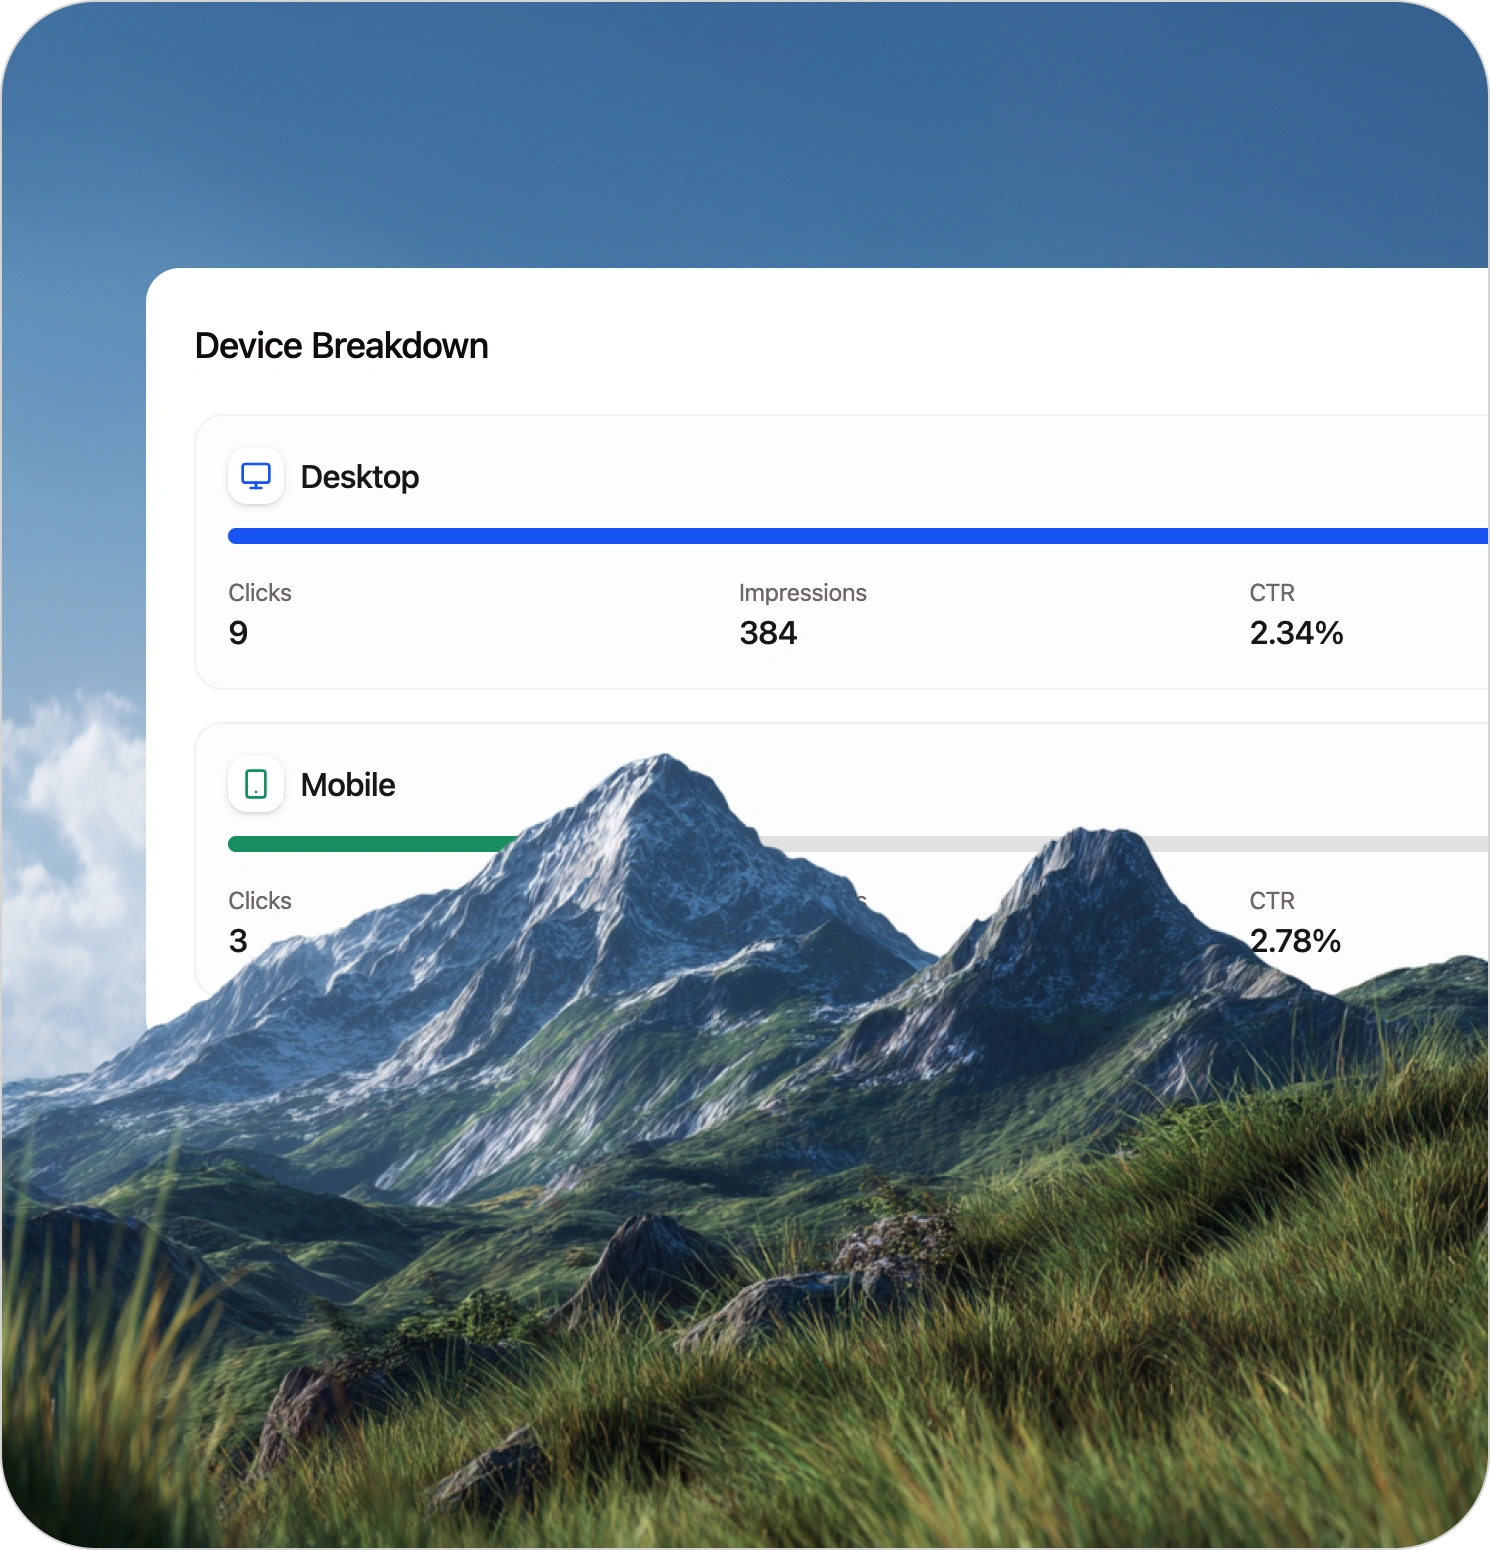
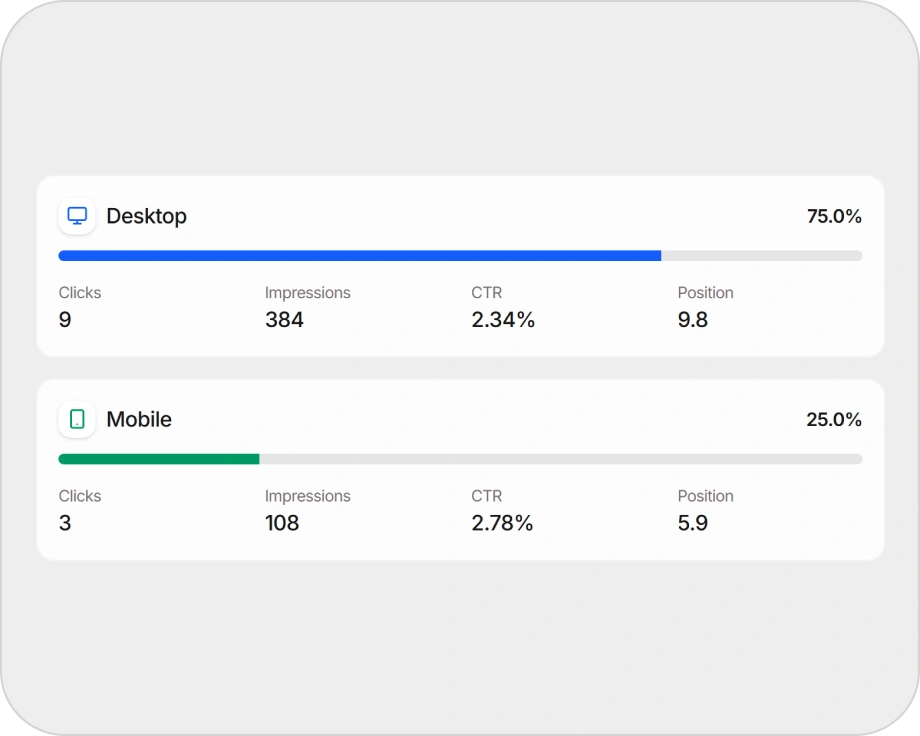
Device and country views
Break performance down further when teams need a more practical view of how visibility is distributed.
Connected feedback loop
Use analytics as an input to content action, not just reporting.
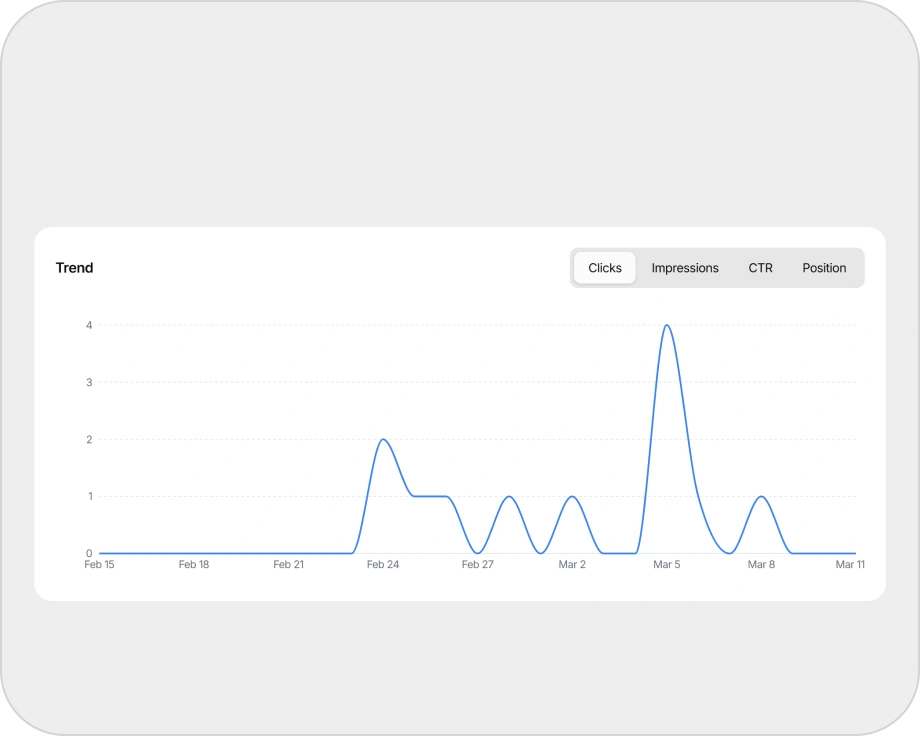
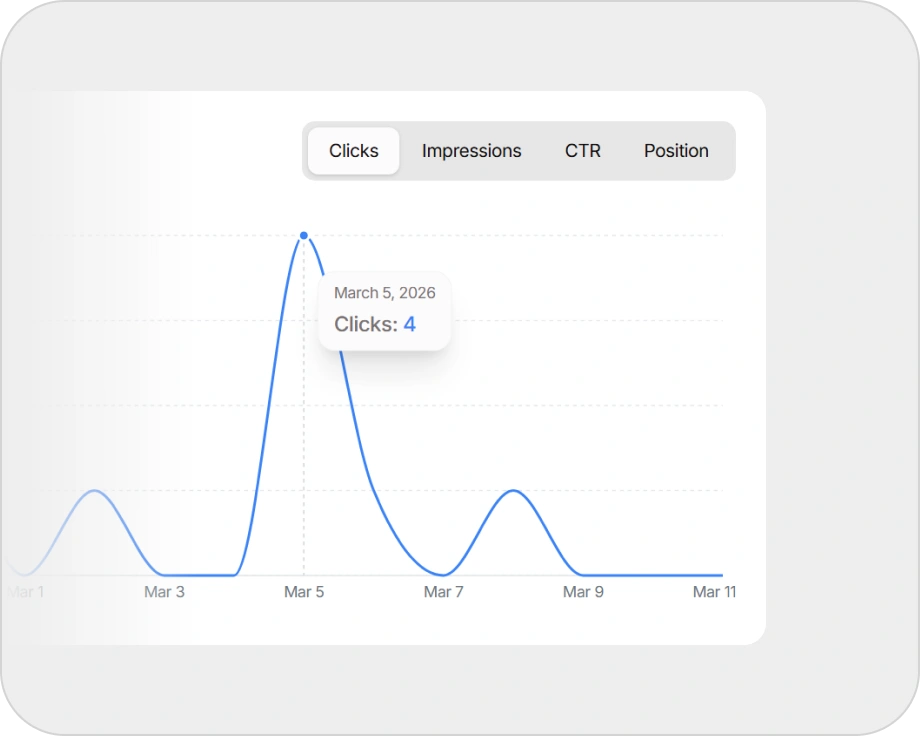
Trend windows that support decisions
Performance needs context over time, not isolated snapshots.
Why it matters
Analytics are only valuable when they change what the team does next. That is the point of this page.
Site Analytics should not be framed as another SEO dashboard. It should be framed as the part of Skayle that turns search signals into editorial decisions. It helps teams answer practical questions fast:
- What is growing?
- What is slipping?
- Which pages deserve a refresh?
- Which queries justify expansion?
- What should we create next?
That makes the system closed-loop instead of fragmented.
How it works
Pull performance data into the workflow
Connect core search signals so the team can see what is happening without leaving the operating system.
Surface pages and queries that deserve attention
The goal is not passive reporting. It is identifying the signals that should trigger action.
Decide what to update, expand, or create
Use performance signals to guide refreshes, topic expansion, and new structured content.
Feed the action back into publishing
Because creation and publishing live inside Skayle, the decision does not die in another dashboard.
Best fit
Frequently asked questions

Turn search data into next actions.
Site Analytics helps teams use rankings, query performance, and page trends to decide what to update, expand, and publish next.